Problem
Urban heat islands are a growing climate risk, but their spatial distribution is hard to grasp. Scattered weather stations don’t provide a full picture.
Solution
Analysis tool combining Landsat satellite data (via Google Earth Engine), CORINE land cover data, and DWD climate measurements. Computes land surface temperatures, identifies hotspots using spatial statistics (Local Moran’s I, Getis-Ord Gi*), and quantifies land use effects on temperature distribution.
Result
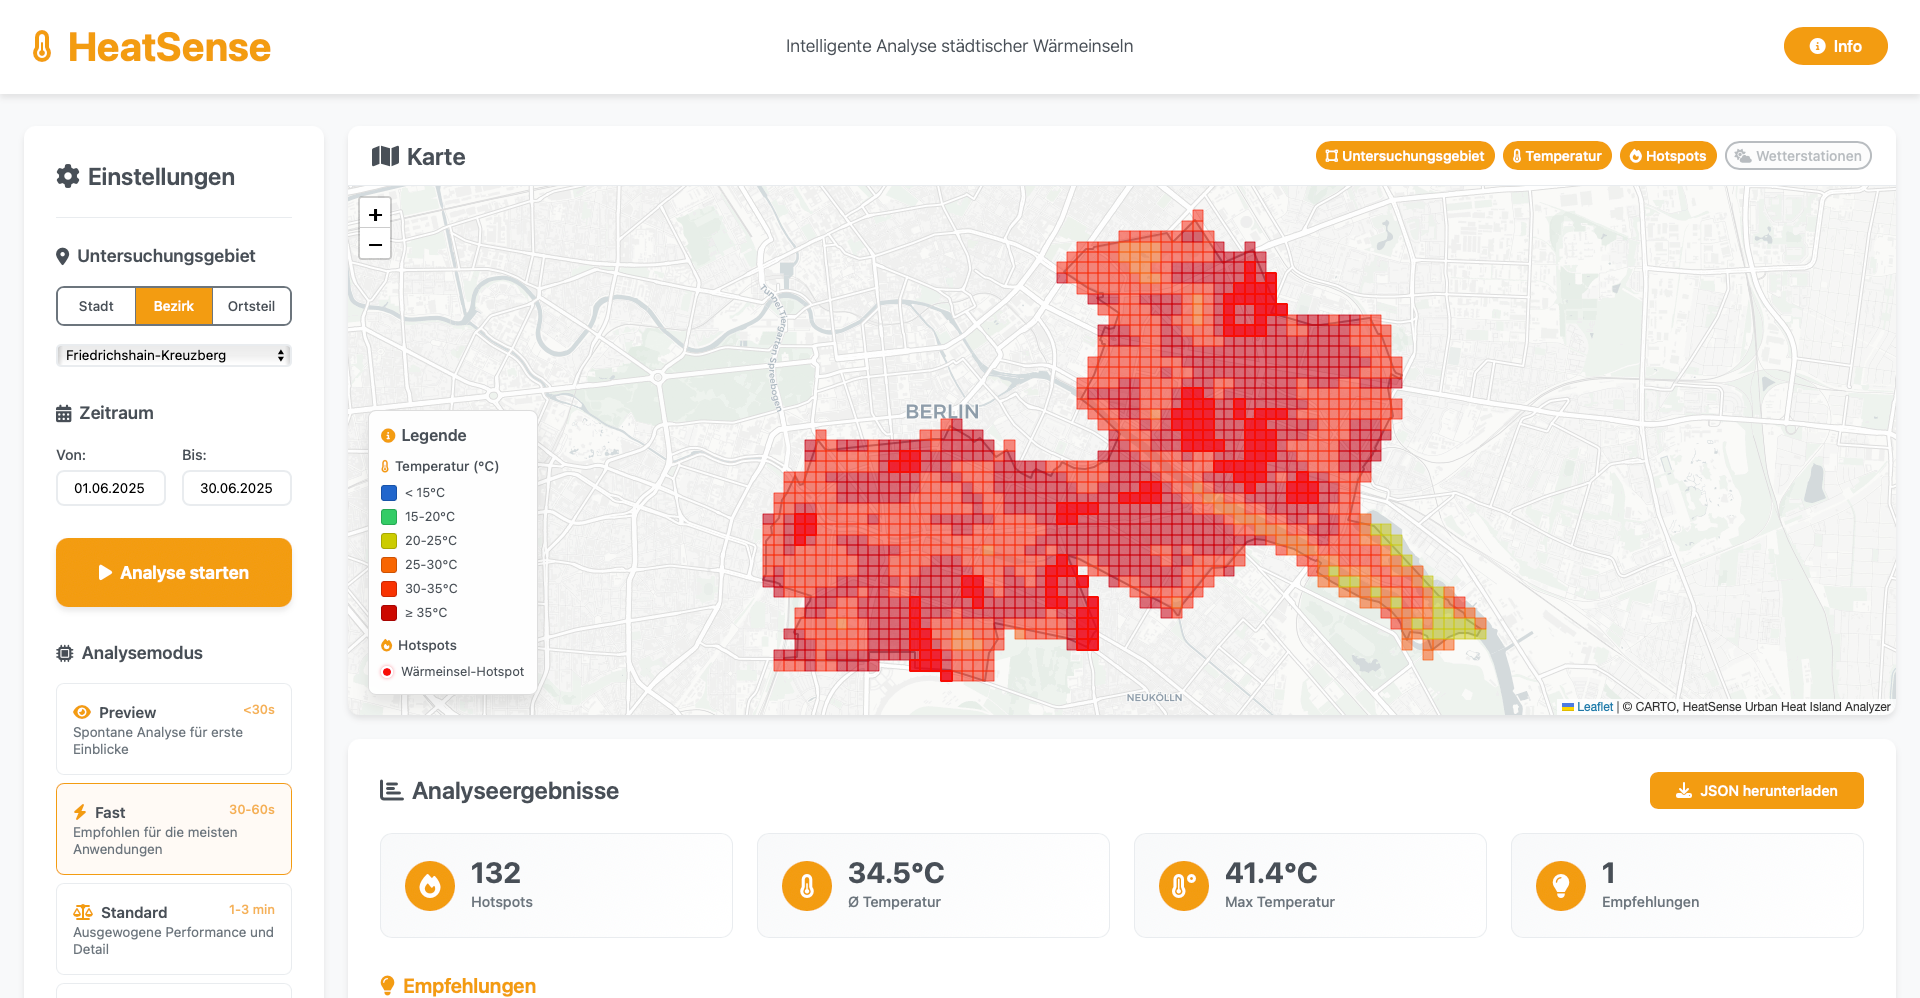
City-wide heat analysis for Berlin with statistically validated hotspot maps. Interactive web application for exploring results.
Lessons Learned
- Google Earth Engine made large-scale Landsat processing feasible without local infrastructure, but the JavaScript API’s documentation is inconsistent. Translating Python examples from research papers to GEE’s API required extensive trial and error.
- Spatial statistics (Local Moran’s I, Getis-Ord Gi*) added real analytical value beyond simple temperature maps. Hotspot analysis distinguishes statistically significant clusters from random variation, which is critical for urban planning applications.
- Combining satellite-derived LST with weather station data revealed systematic biases: ground stations consistently underestimate heat island intensity in dense urban areas because they are typically placed in parks or open spaces.
Deep Dive
The analysis combines three data layers. Landsat 8/9 thermal bands provide land surface temperature (LST) at 100m resolution, processed via Google Earth Engine’s cloud computing. CORINE land cover data classifies each pixel’s land use type (built-up, green space, water, industrial). DWD weather station measurements provide ground-truth temperature readings. The core analysis uses PySAL’s spatial statistics: Local Moran’s I identifies spatial clusters of similar temperature values, while Getis-Ord Gi* detects statistically significant hot and cold spots. Overlaying hotspot maps with land cover classification quantifies the temperature effect of different land use types. The Flask web application renders results on a Leaflet map with layer controls for switching between LST, hotspot significance, and land cover.